This analysis attempts to identify the most promising international markets for Buffer to target after the US.
We’ll examine the country-level funnel from website traffic through signups and paid conversions to find markets that combine sufficient scale with strong conversion performance. We’ll also look at the current makeup of MAU and paying customers and factor those into a composite score that we’ll use to rank opportunities.
What We Found
The UK stands out as a top expansion opportunity when we factor in both funnel performance and existing user base. The UK accounts for around 12% of Buffer’s paying customers and 12% of MAU outside the US, which represents a significant base from which to grow.
Canada and Australia rank second and third, and Germany and France round out the top five, with solid conversion rates for each of these countries.
The composite score balances five factors: traffic volume, signup rate, conversion rate, MAU proportion, and paying customer proportion. Countries with high traffic volume but low conversion rates, such as India and Bangladesh, score lower, but are still worth considering.
On the flip side, countries with higher conversion rates but less traffic, like smaller European markets, are also pushed down the list a bit.
US Baseline
Before diving into international markets, let’s establish the US baseline to use as a reference point. The data spans 25 months from February 2024 through February 2026. Conversions and conversion rate refer to paid conversions that occurred within 60 days of signing up.
The US has a 3.6% signup rate and 5.9% conversion rate. These metrics will serve as our benchmarks when evaluating other potential markets.
Data Collection
The data comes from the dbt_buffer.country_expansion_funnel table, which tracks the full funnel from website sessions through paid conversions by country and month. The data spans from February 2024 to February 2026. and includes 109 countries.
We aggregate across all available months to get more reliable conversion rate estimates. We filter to markets with at least 1,000 visitors to make sure that the sample sizes are meaningful.
Code
# get the most recent non-null mau and paying customer proportions for each countrylatest_mau <- funnel %>%filter(country_iso_code !="Unknown",!is.na(mau_proportion)) %>%group_by(country_iso_code) %>%filter(month ==max(month)) %>%ungroup() %>%select(country_iso_code, mau_proportion)latest_paying <- funnel %>%filter(country_iso_code !="Unknown",!is.na(paying_customer_proportion)) %>%group_by(country_iso_code) %>%filter(month ==max(month)) %>%ungroup() %>%select(country_iso_code, paying_customer_proportion)latest_proportions <- latest_mau %>%full_join(latest_paying, by ="country_iso_code")# aggregate funnel metrics across all months (including US for comparison)country_totals <- funnel %>%filter(country_iso_code !="Unknown") %>%group_by(country_iso_code, country_name, continent_code, continent_name) %>%summarise(total_sessions =sum(sessions, na.rm =TRUE),total_visitors =sum(visitors, na.rm =TRUE),total_signups =sum(signups, na.rm =TRUE),total_activations =sum(activations, na.rm =TRUE),total_conversions =sum(conversions, na.rm =TRUE),n_months =n_distinct(month),.groups ="drop" ) %>%mutate(signup_rate = total_signups / total_visitors,activation_rate =ifelse(total_signups >0, total_activations / total_signups, 0),conversion_rate =ifelse(total_signups >0, total_conversions / total_signups, 0) ) %>%left_join(latest_proportions, by ="country_iso_code")country_totals <- country_totals %>%filter(total_visitors >=1000)cat("Countries with 1,000+ visitors:", nrow(country_totals), "\n")
To find the best expansion markets, we balance five factors:
Traffic volume, which tells us if the market is big enough to be worth investing in.
Signup rate, which measures how often visitors from this country sign up for Buffer.
Conversion rate, which measures how often those signups become paying customers.
MAU proportion, which tells us what share of Buffer’s monthly active users are from this country.
Paying customer proportion, which tells us what share of Buffer’s paying customers are from this country.
The first three factors tell us about the funnel efficiency. The last two tell us about the current user/customer base. Countries with more existing users and paying customers may be easier to expand since there’s already word-of-mouth and market awareness.
We weight these factors as follows: 15% volume, 20% signup rate, 25% conversion rate, 15% MAU proportion, and 25% paying customer proportion. Each metric is scaled from 0-100 before combining. For volume, we use a logarithmic scale so huge markets like India don’t completely dominate.
Code
# function to scale any metric from 0-100normalize <-function(x) { (x -min(x, na.rm =TRUE)) / (max(x, na.rm =TRUE) -min(x, na.rm =TRUE)) *100}country_scored <- country_totals %>%filter(!is.na(mau_proportion), !is.na(paying_customer_proportion)) %>%mutate(# use log scale for visitors so huge markets don't dominatelog_visitors =log10(total_visitors),# scale each component 0-100volume_score =normalize(log_visitors),signup_score =normalize(signup_rate),conversion_score =normalize(conversion_rate),mau_score =normalize(mau_proportion),paying_score =normalize(paying_customer_proportion),# weighted averageopportunity_score = (0.15* volume_score) + (0.20* signup_score) + (0.25* conversion_score) + (0.15* mau_score) + (0.25* paying_score) ) %>%arrange(desc(opportunity_score))
Top Expansion Opportunities
The table below ranks countries by their composite opportunity score using data from 2025 onwards. Markets at the top combine meaningful traffic volume, strong conversion performance, and an existing user base.
The UK leads the pack with the best balance of volume and conversion quality, followed by Canada, Australia, Germany, and The Netherlands. None of the other countries make up at least 2% of Buffer’s paying customer base.
Large markets like Brazil, The Philippines, and India are clustered together, mostly because of their high traffic volume and relatively low conversion rates.
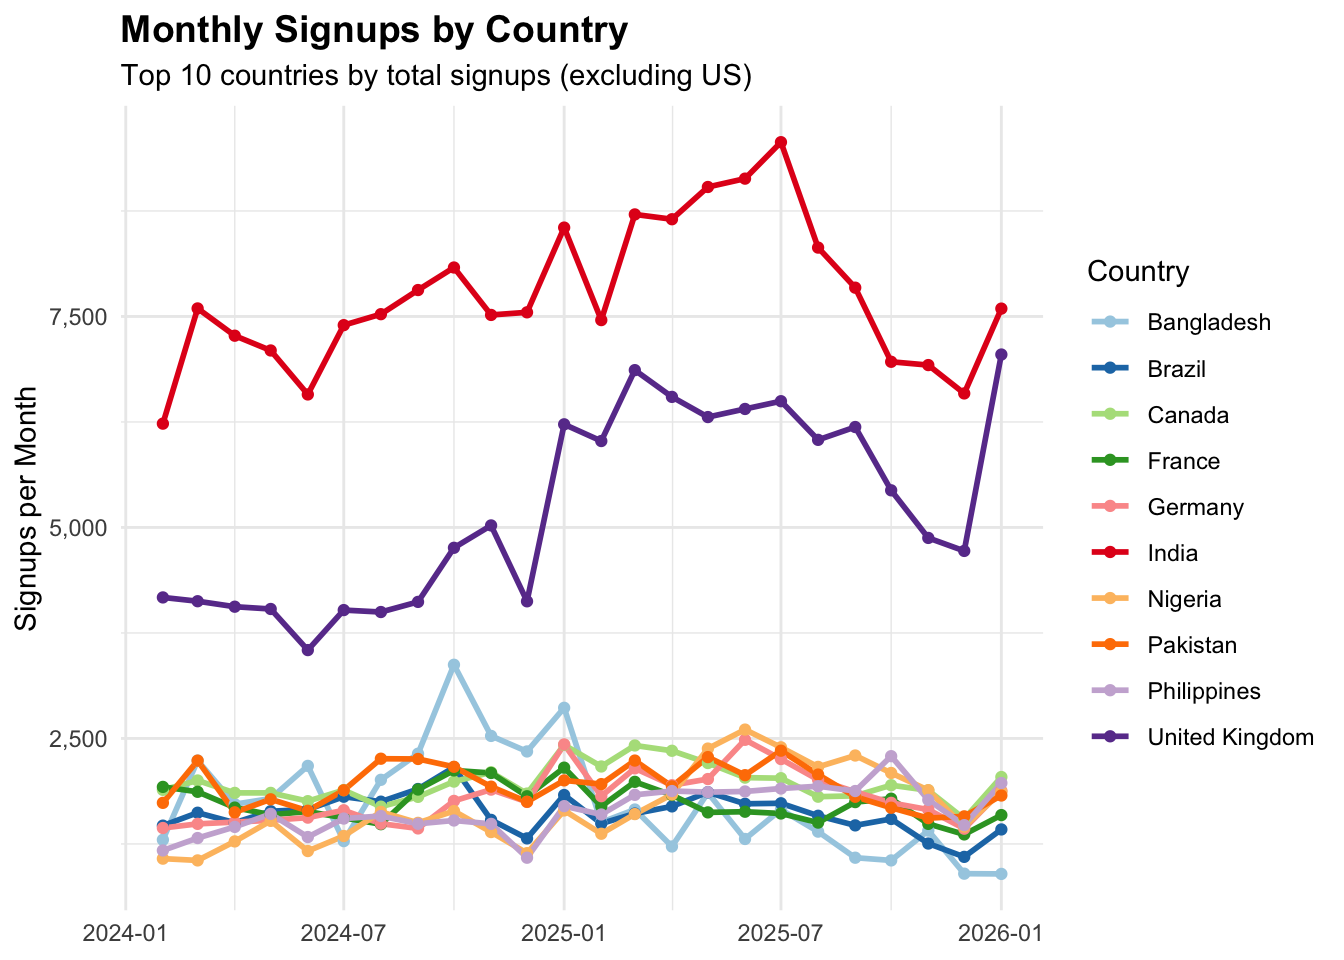
Top Countries by Signups
India generates the most signups outside the US, followed by the UK.
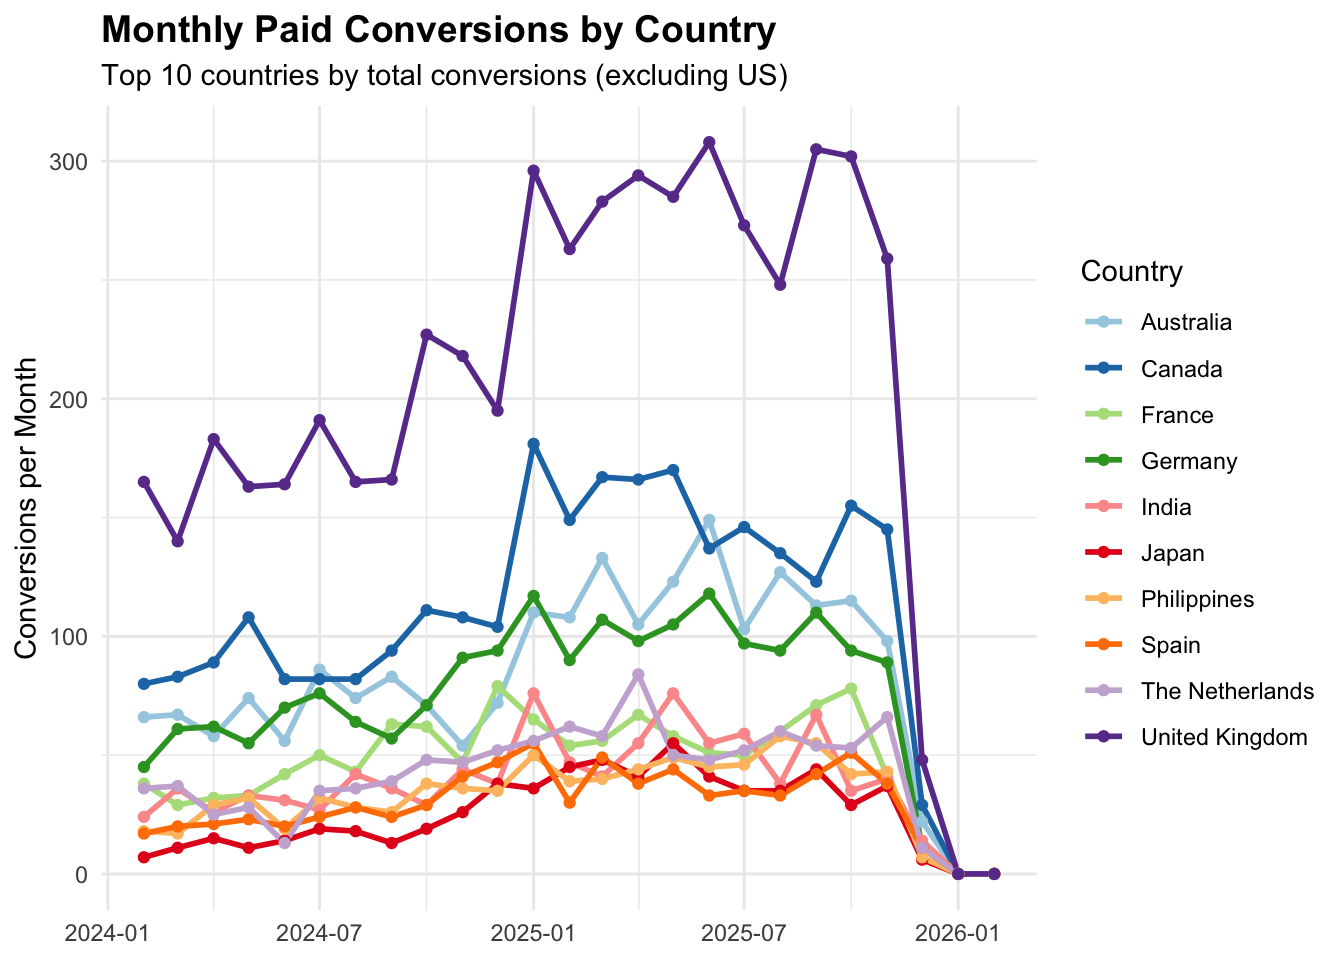
Top Countries by Paid Conversions
The UK leads in paid conversions, followed by Canada and Australia. These three English-speaking markets account for a large share of all international conversions. Note that conversions drop to zero in recent months due to the 60-day attribution window.
Germany should be noted as the top non-English speaking market in terms of paid conversions.
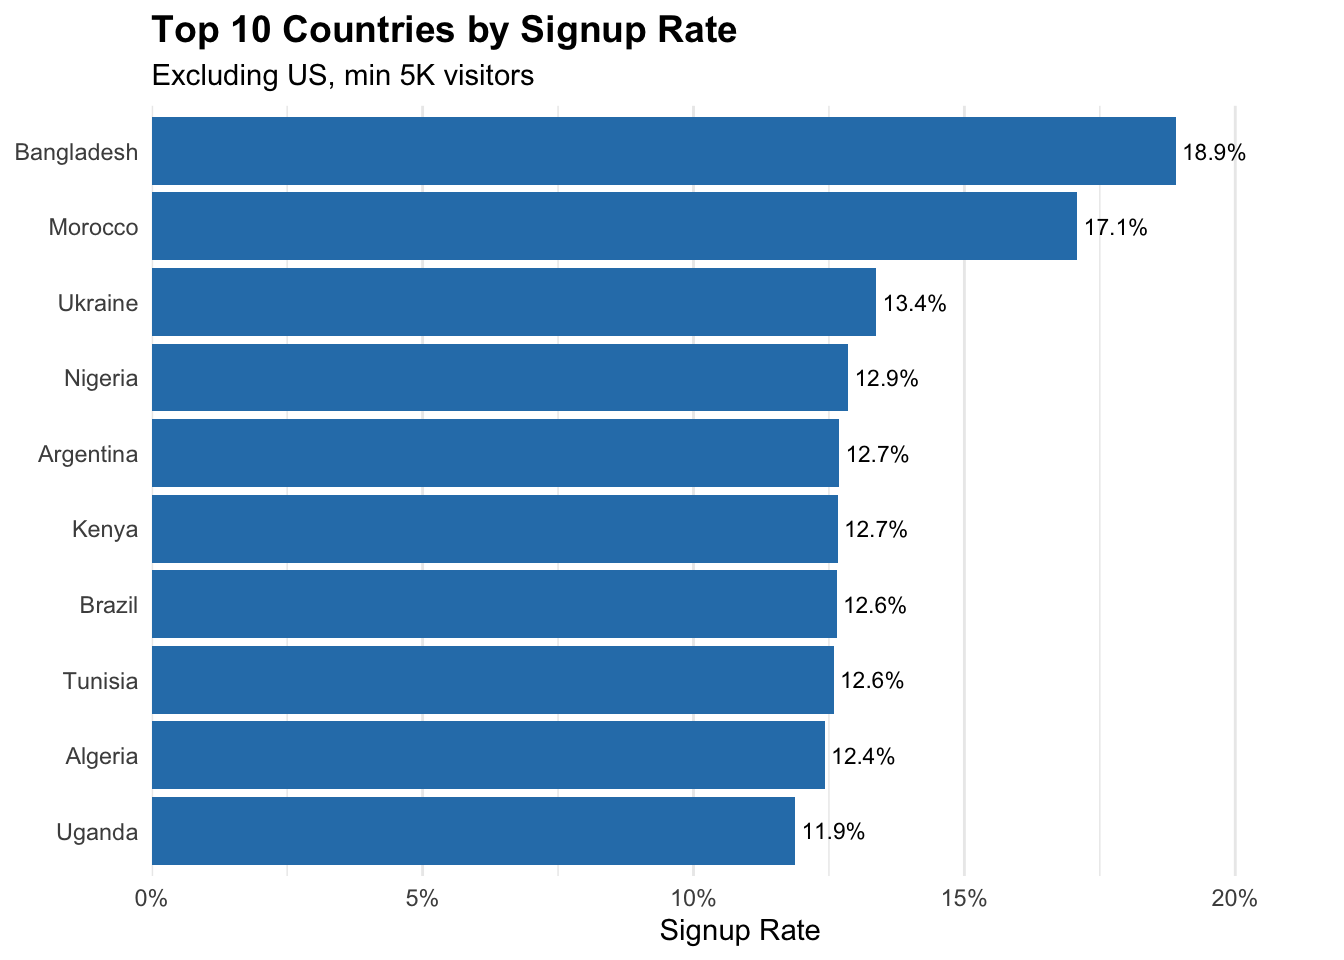
Top Countries by Signup Rate
We filter to countries with at least 5,000 total visitors to ensure reliable rate estimates.
African, South Asian, and Latin American markets have the highest signup rates — often 3-5x higher than the US rate of 3.6%.
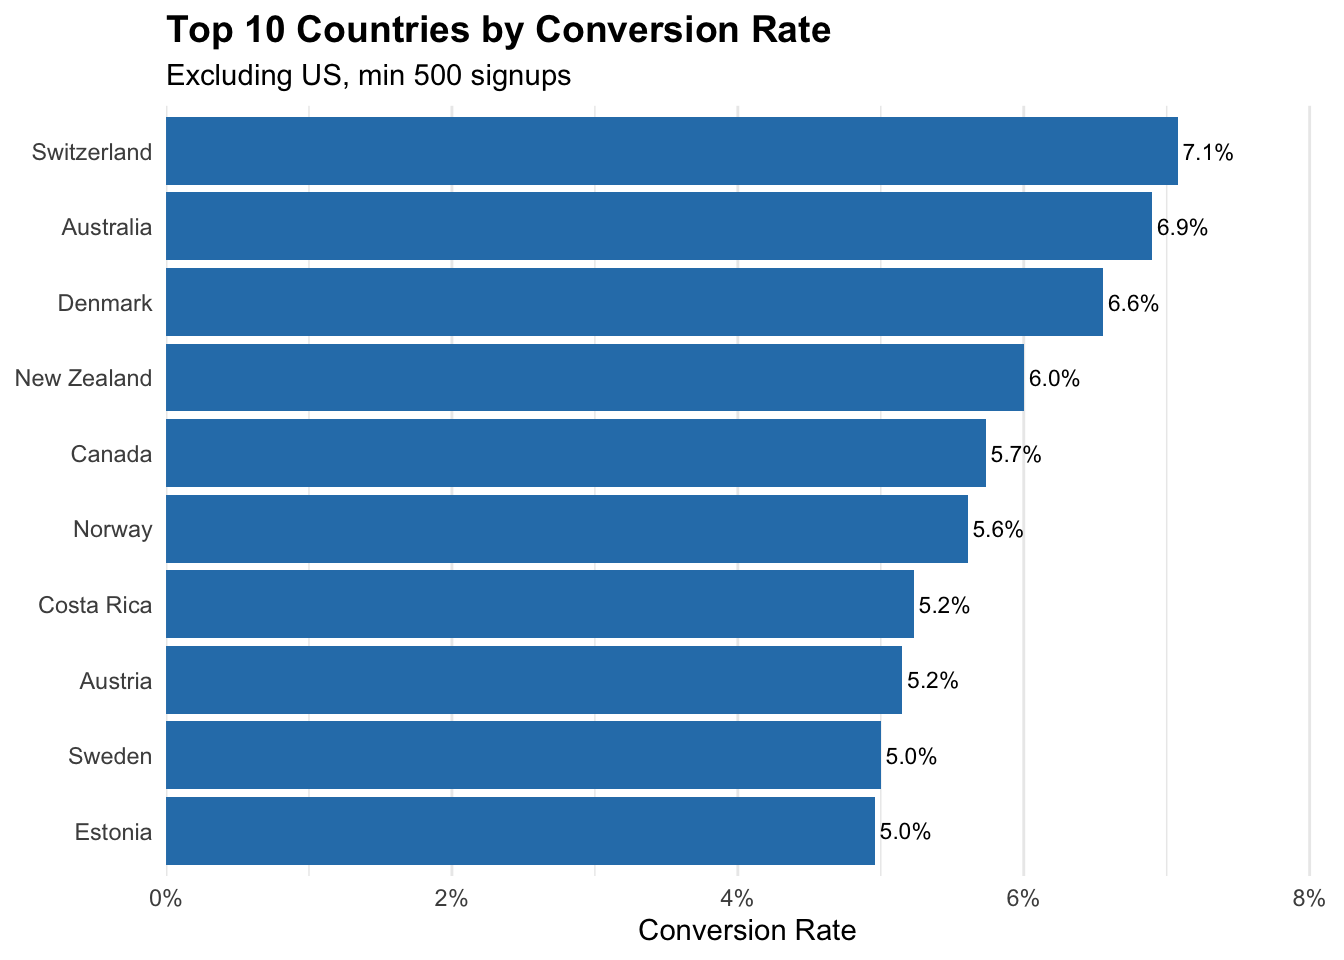
Top Countries by Paid Conversion Rate
We filter to countries with at least 500 total signups to ensure meaningful conversion rate estimates.
The conversion rate picture is almost the inverse of signup rates. Switzerland, Australia, Denmark, New Zealand, and Canada lead. These are markets with higher GDP per capita and established SaaS adoption patterns.
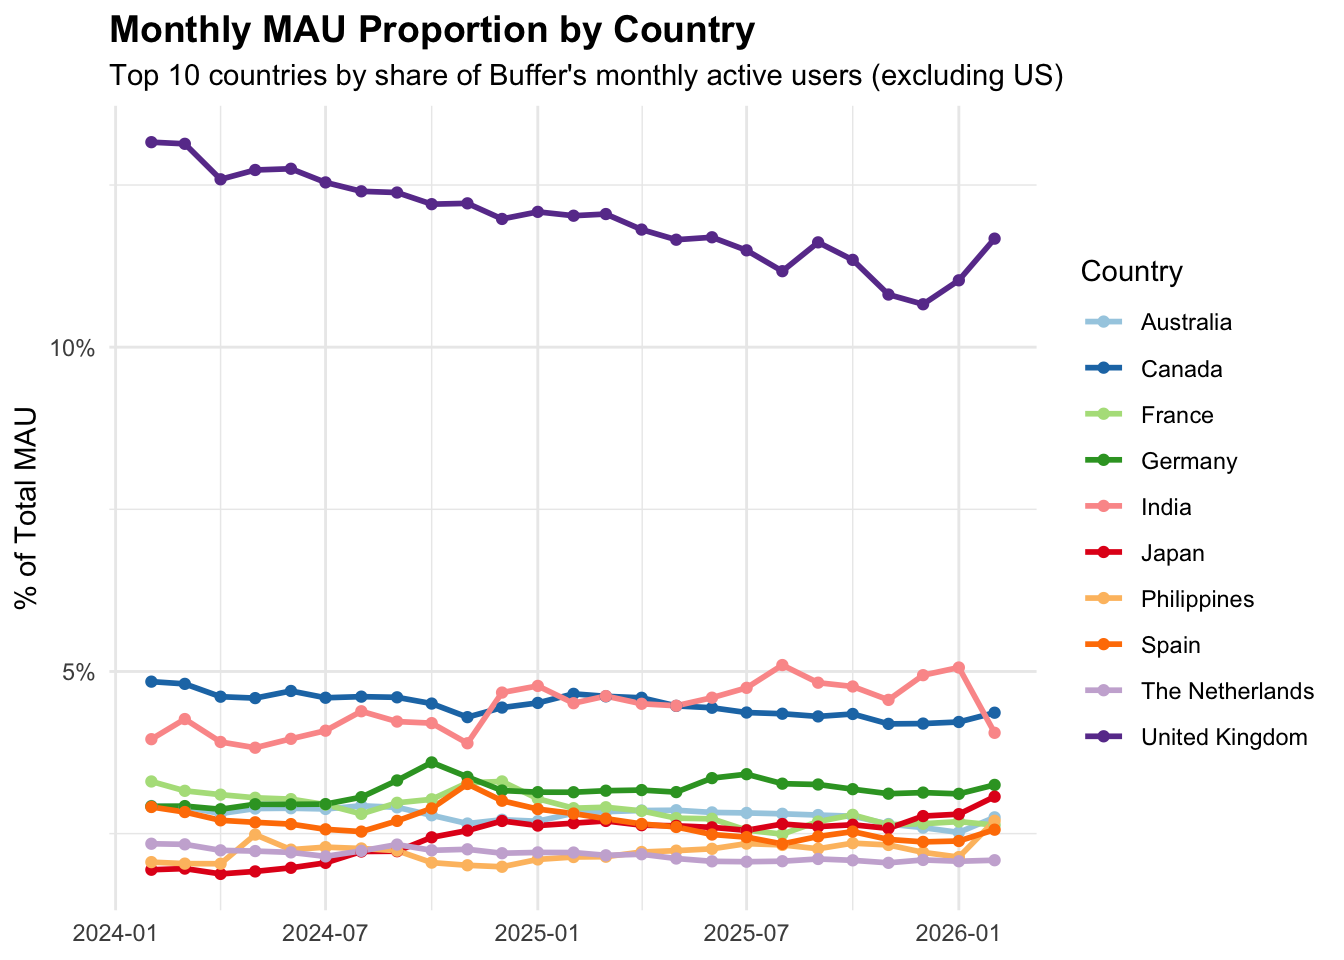
MAU Proportion by Country
This shows what share of Buffer’s monthly active users come from each country. Countries with a larger existing user base may be easier to expand since there’s already word-of-mouth and market awareness.
The UK has the largest share of MAU outside the US, followed by India and Canada. Japan may be one to keep an eye on, as the proportion has been growing steadily.
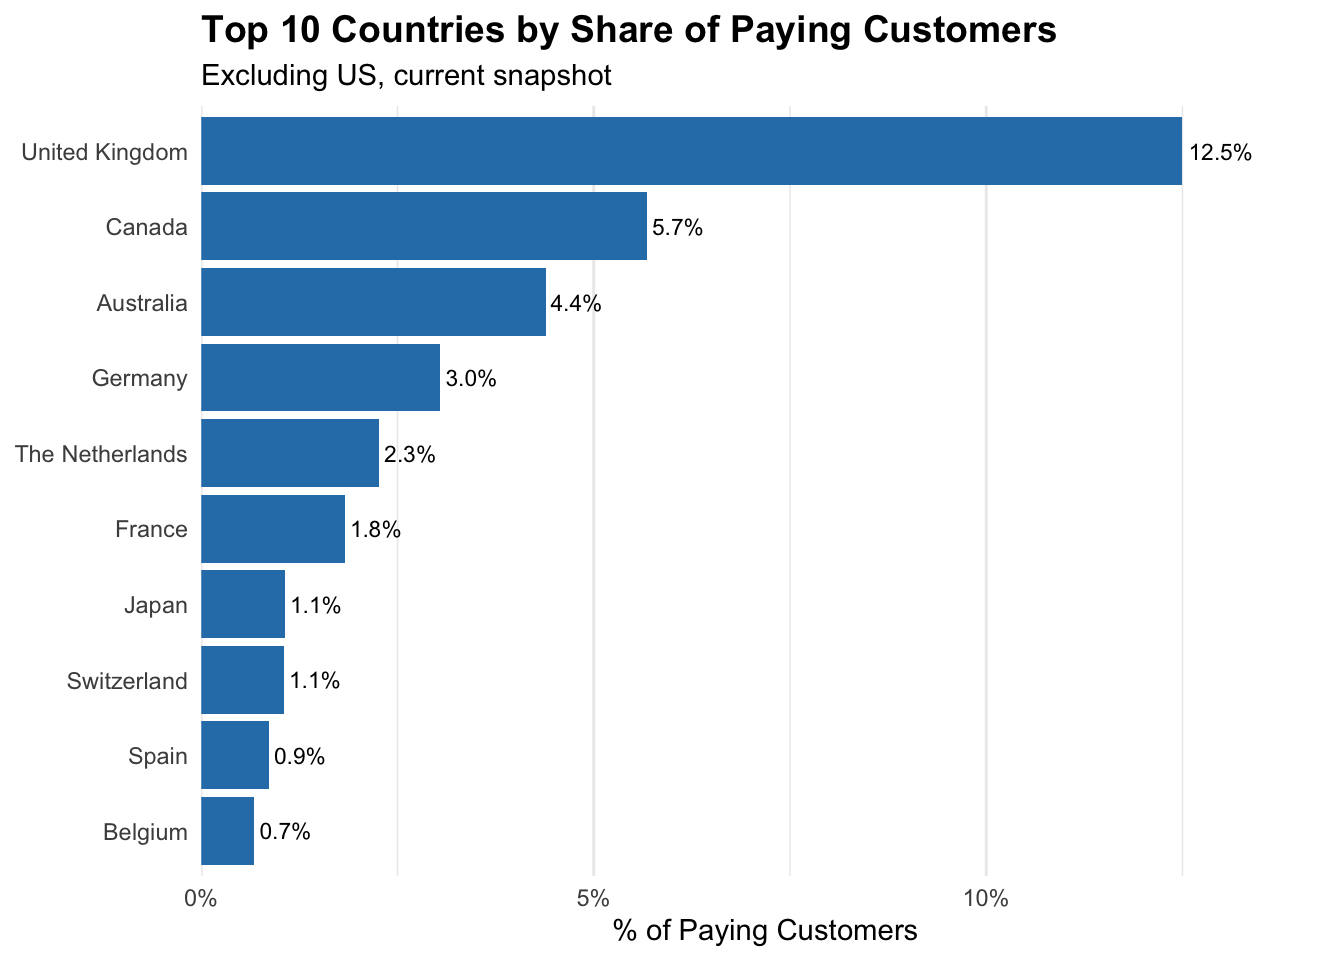
Paying Customer Proportion by Country
This shows what share of Buffer’s paying customers come from each country.
The US makes up over half of Buffer’s paying customers. The UK is second with around 12%, followed by Canada, Australia, and Germany.
Europe leads in both visitors (8.2M) and conversions (14.6K), with a 4.9% signup rate and 3.6% paid conversion rate.
Asia has similar traffic (7.7M visitors) but higher signup rates (6.3%) and lower conversion (1.3%).
Africa has a high signup rate at 12.3% but the lowest conversion rate at 0.95%. These markets have clear product interest but face barriers to paid plans.
Australia + New Zealand have a great combined conversion rate of 6.8%, which is higher than the US benchmark.