This analysis uses survival analysis to understand the retention patterns of monthly Essentials subscriptions. Specifically, we want to answer the question “Given that a subscription has survived to month N, what’s the probability it will reach at least 12 months?”
What We Found
Only about 27% of monthly New Buffer subscriptions make it to the 12 month mark. Unsurprisingly, the first month is the one in which churn is most likely. About 10% of subscriptions cancel before paying a second invoice, and another 13% drop off before month 2. By month 3, we’ve already lost nearly half of all new subscriptions.
However, if a subscription survives to month 3, its chances of reaching 12 months jump up to 47%, and making it to month 4 makes it more likely than not that the subscription will make it to 12 months.
This supports what we already know, that early engagement is critical. The subscriptions most at risk are the newest ones, and the risk decreases substantially with each passing month.
Data Collection
We’ll pull monthly Essentials subscriptions from the past 5 years that have paid at least one invoice. For each subscription, we calculate the tenure in months and whether the subscription has been canceled or not.
Code
sql <-" select id as subscription_id , customer_id , plan_id , created_at , canceled_at , status , paid_invoice_count , date_diff( date(coalesce(canceled_at, current_timestamp())), date(created_at), month ) as tenure_months , case when canceled_at is not null then 1 else 0 end as is_canceled from dbt_buffer.stripe_subscriptions where paid_invoice_count >= 1 and lower(plan_name) like '%essentials%' and plan_interval = 'month' and created_at >= timestamp_sub(current_timestamp(), interval 5 year)"subscriptions <-bq_query(sql = sql)
Data Preparation
We need to prepare the data for survival analysis. The key variables we need are the following:
time: The duration in months until the churn event or censoring (if still active)
status: Whether the subscription has been canceled (1 = canceled, 0 = still active/censored)
Active subscriptions (status = 'active' or status = 'past_due') are right-censored, meaning we know they’ve survived at least this long, but we don’t know when (or if) they’ll cancel.
Code
# prepare survival datasurvival_data <- subscriptions %>%mutate(# Cap tenure at 24 months for analysis (we care about 12-month retention)tenure_months_capped =pmin(tenure_months, 24),# Event indicator: 1 if canceled within observation window, 0 if censoredevent =case_when( is_canceled ==1& tenure_months <=24~1,TRUE~0 ) )# summary of the datacat("Total subscriptions:", nrow(survival_data), "\n")
Survival analysis is a statistical method originally developed to study time-to-event data in medical research, for example how long patients survive after treatment. It’s well-suited for subscription retention because it accounts for the issue of subscriptions not having churned yet.
For example, if a customer has been subscribed for 6 months and is still active, we know they’ve survived at least 6 months, but we don’t know when, or if, they’ll cancel. Traditional methods would either exclude these customers or treat them as if they’ll never churn - both of which bias the results. Survival analysis handles this censoring properly by using all available information without making unfounded assumptions.
The Kaplan-Meier estimator we use here estimates the survival function S(t), which gives the probability that a subscription remains active at least t months after creation.
Code
# fit Kaplan-Meier survival curvekm_fit <-survfit(Surv(tenure_months_capped, event) ~1, data = survival_data)# summary at key time pointssummary(km_fit, times =c(1, 3, 6, 9, 12))
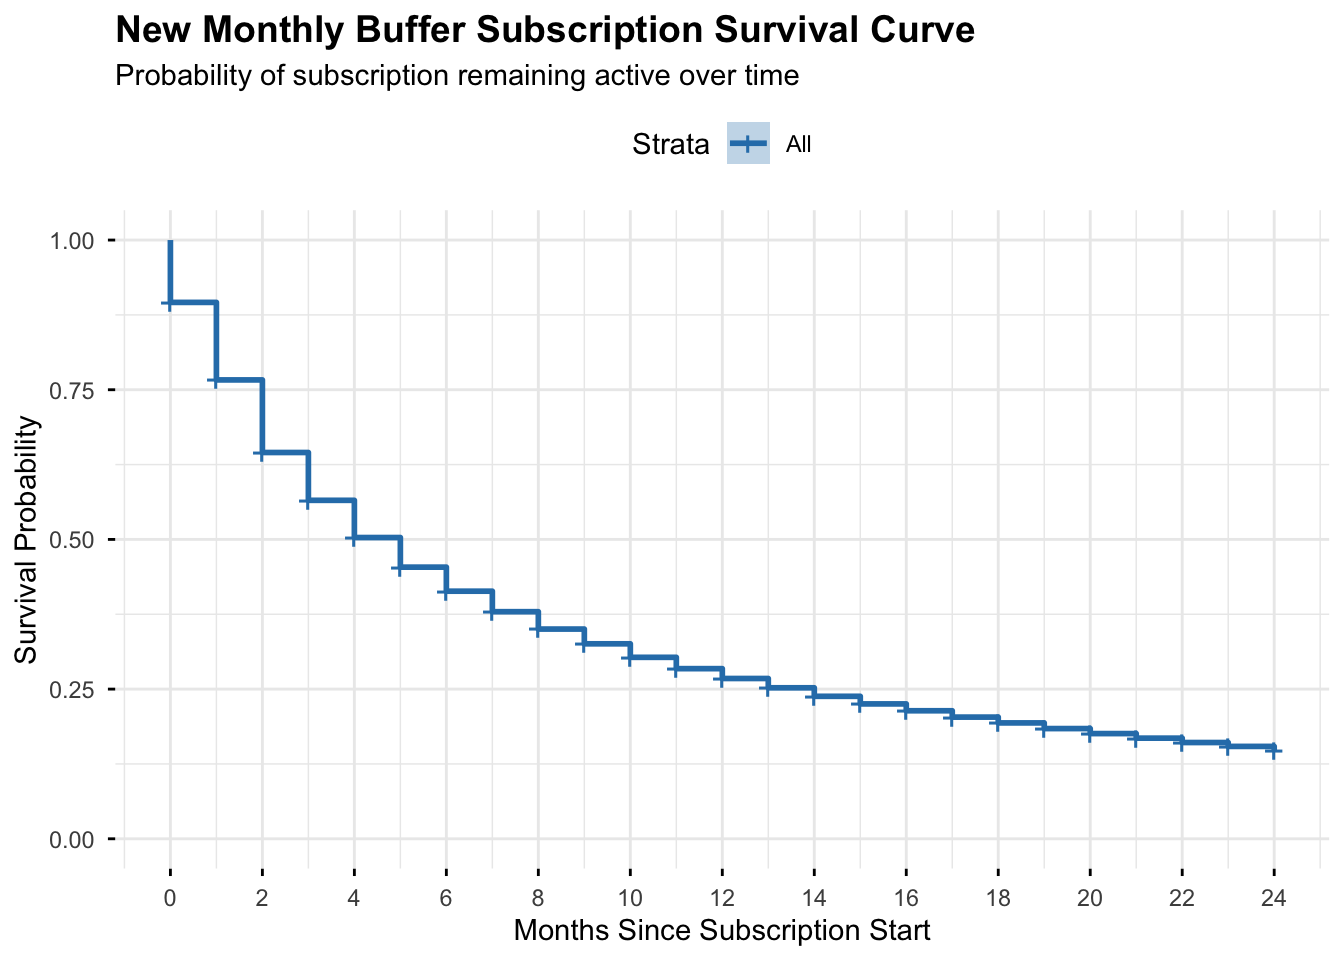
The table shows survival probabilities at key milestones. After 1 month, about 77% of subscriptions are still active. By month 12, only 27% remain. The “n.risk” column shows how many subscriptions are still being observed at each time point, and “n.event” shows how many canceled during that period.
Now let’s plot this survival curve. It shows the probability of a subscription remaining active over time. The shaded area represents the 95% confidence interval.
The curve drops steeply in the first few months and then gradually flattens out. This shape is typical for subscription businesses. Early churn is high as customers who signed up but didn’t find value leave quickly, while those who stick around become increasingly likely to stay.
Probability of Reaching 12 Months
This is the key insight: given that a subscription has survived to month N, what’s the probability it will reach month 12?
The formula is: P(survive to 12 | survived to N) = S(12) / S(N)
Where S(t) is the survival probability at time t from the Kaplan-Meier curve.
Code
# extract survival probabilities at each monthsurv_summary <-summary(km_fit, times =0:12)# create a data frame with survival probabilitiessurv_probs <-data.frame(month = surv_summary$time,survival_prob = surv_summary$surv,n_at_risk = surv_summary$n.risk,n_events = surv_summary$n.event,std_error = surv_summary$std.err)# get survival probability at month 12s_12 <- surv_probs$survival_prob[surv_probs$month ==12]# calculate conditional probability of reaching 12 monthsconditional_probs <- surv_probs %>%filter(month <=12) %>%mutate(prob_reach_12_given_survived_to_n = s_12 / survival_prob,# Calculate confidence interval using delta method approximationlower_ci =pmax(0, prob_reach_12_given_survived_to_n -1.96* std_error / survival_prob),upper_ci =pmin(1, prob_reach_12_given_survived_to_n +1.96* std_error / survival_prob) ) %>%select(`Month`= month,`Survival Prob`= survival_prob,`At Risk`= n_at_risk,`P(Reach 12 | Survived to Month)`= prob_reach_12_given_survived_to_n )knitr::kable( conditional_probs,digits =3,align ="rrrr",caption ="Conditional probability of reaching 12 months given survival to each month")
Conditional probability of reaching 12 months given survival to each month
Month
Survival Prob
At Risk
P(Reach 12 | Survived to Month)
0
0.896
119068
0.299
1
0.766
104531
0.349
2
0.645
86882
0.415
3
0.565
70981
0.474
4
0.503
60347
0.532
5
0.454
52004
0.590
6
0.414
45542
0.647
7
0.379
40219
0.706
8
0.350
35702
0.764
9
0.326
31859
0.822
10
0.303
28511
0.883
11
0.284
25551
0.942
12
0.268
23109
1.000
The “Survival Prob” column shows the overall probability of being active at each month. The “At Risk” column shows how many subscriptions we’re still tracking at that point. The key column is the last one - it shows how the probability of reaching 12 months increases as a subscription ages.
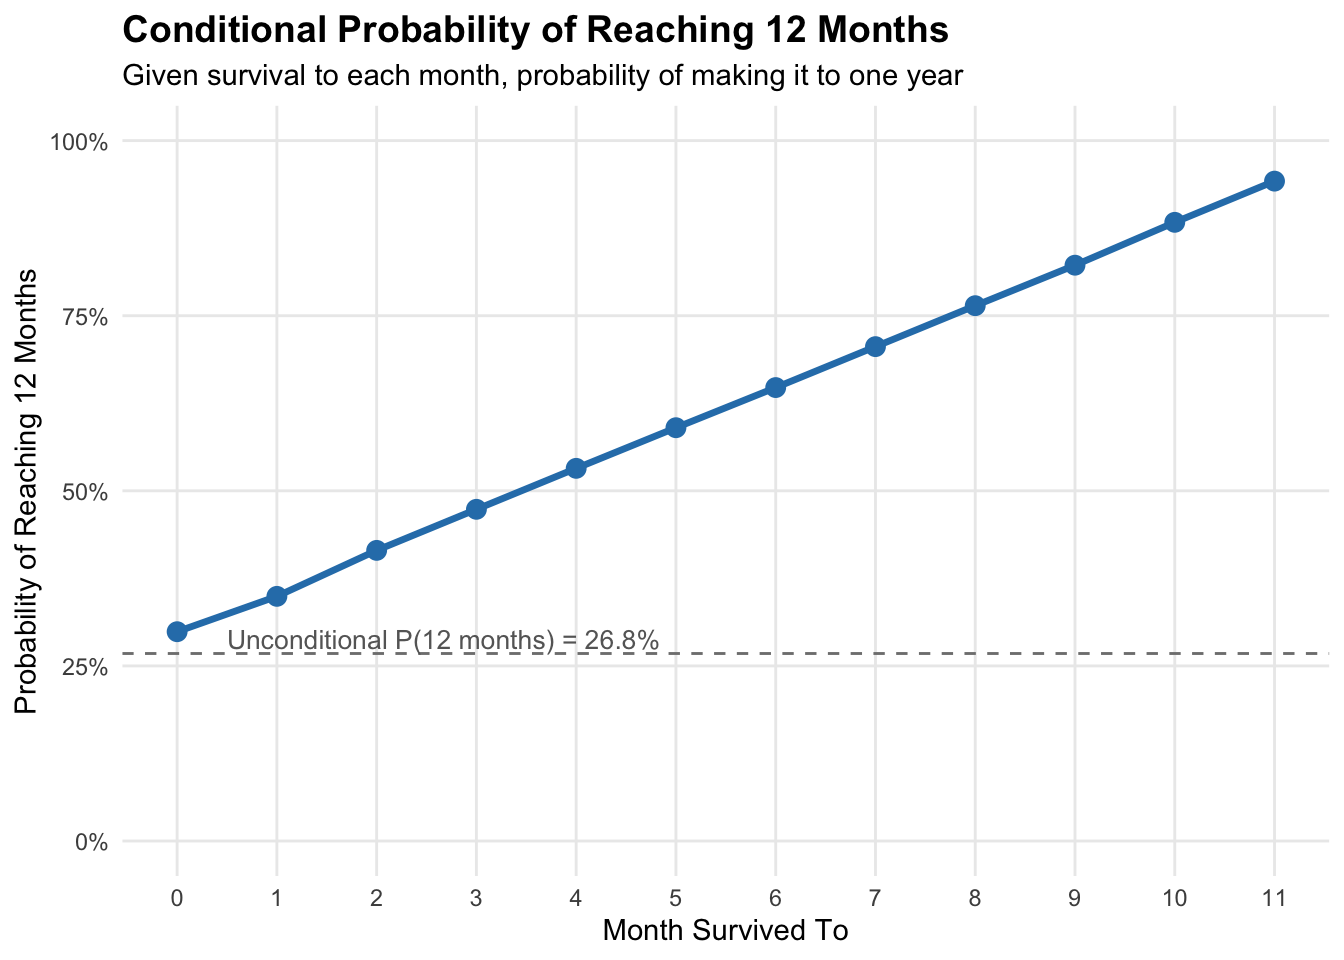
We can visualize these probabilities, which increase roughly linearly.
The dashed line shows the unconditional probability (~27%) - the baseline odds for any new subscription. Each additional month of survival adds roughly 5-6 percentage points to the probability of reaching 12 months. By month 4, a subscription has crossed into “more likely than not” territory above 50%.
Breakdown by Plan
The analysis includes 119,068 monthly Essentials subscriptions: 90,547 individual Essentials plans and 28,521 Essentials Team plans.
Month Survived
All Plans
Essentials
Essentials Team
0
29.9%
28.8%
32.9%
1
34.9%
33.9%
37.7%
2
41.5%
40.3%
44.7%
3
47.4%
46.3%
50.2%
4
53.2%
52.2%
55.7%
5
59.0%
58.2%
61.1%
6
64.7%
64.1%
66.3%
7
70.6%
70.1%
71.8%
8
76.4%
76.1%
77.2%
9
82.2%
82.1%
82.5%
10
88.3%
88.2%
88.6%
11
94.2%
94.2%
94.3%
Essentials Team plans show slightly better retention in the early months - a 33% chance of reaching 12 months at signup compared to 29% for individual plans. This advantage narrows over time, and by month 9 both plan types are essentially identical at around 82%.
The pattern is clear: the longer a subscription survives, the more likely it is to stick around. This is typical for subscription businesses - the early months are when most churn happens, and customers who make it past that initial period tend to stay much longer.
Caveats
This analysis assumes that cancellation patterns are relatively stable over the 5-year period. Cohort effects (e.g., subscriptions from 2020 behaving differently than 2024) are not accounted for.
The survival function treats all cancellations equally, regardless of reason (voluntary churn vs. payment failure vs. fraud).
Subscriptions still active are right-censored at their current tenure, which assumes they will follow similar patterns to historical subscriptions.