Threads supports three main post formats: text, images, and video. In this analysis we’ll look at whether format type is associated with differences in engagement rate, first by comparing simple medians, and then by controlling for differences across accounts using fixed-effects regression and Z-score analysis.
What We Found
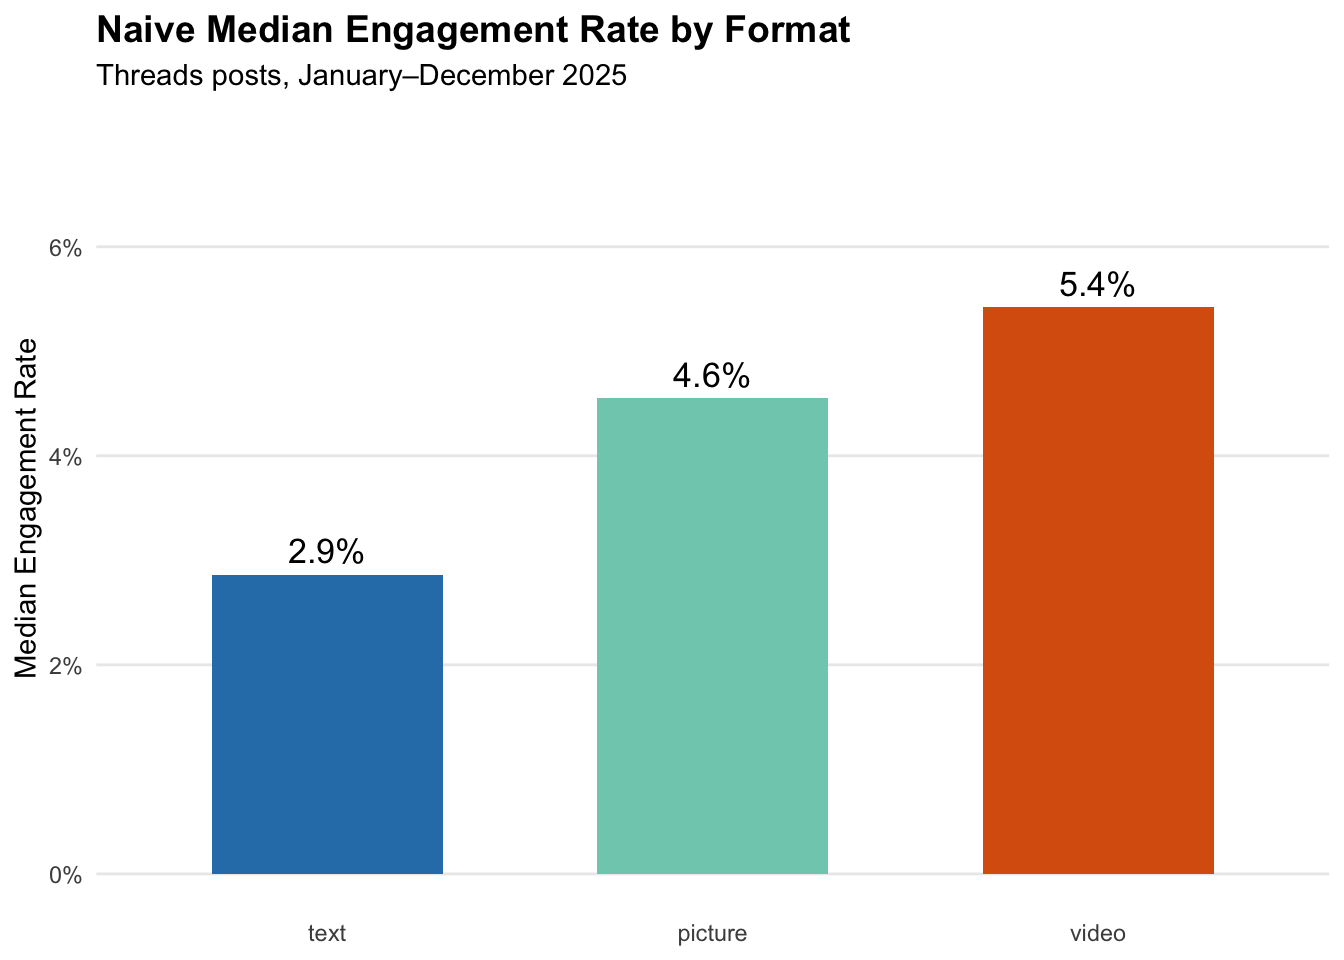
On the surface, video posts appear to outperform the other formats. The naive median engagement rate for video posts is 5.4%, compared to 4.6% for images and 2.9% for text. But this comparison mixes together large and small accounts, accounts in different niches, and accounts that specialize in one format over another.
When we control for account-level differences by comparing each profile to itself, the picture changes somewhat. Within the same account, video posts perform about 20% better than image posts on average, and this result is statistically significant. Text and image posts are nearly indistinguishable — the difference is small and not statistically significant.
The Z-score analysis tells a more nuanced story. Accounts that post all three formats show essentially no consistent winner across any pairing. Video outperforms image in only 48% of profiles, and video versus text is similarly split. The within-profile advantage of any one format is not reliable across accounts.
Data Collection
The SQL below returns around 4.7 million Threads posts sent in 2025, joined with media type from Buffer’s segment events table. We then filter down to posts with at least one view and at least one engagement before analysis.
Code
sql <-" select u.id as post_id , u.profile_id , u.user_id , spc.media_type , date(u.sent_at) as date , u.likes , u.replies , u.reposts , u.views , u.engagement_rate from dbt_buffer.publish_updates as u inner join dbt_buffer.segment_posts_created as spc on spc.post_id = u.id where u.profile_service = 'threads' and u.sent_at >= '2025-01-01' and u.sent_at < '2026-01-01' and u.sent_at is not null and spc.media_type in ('text', 'picture', 'video')"# get data from BigQueryposts <-bq_query(sql = sql)
Data Preparation
Threads calculates engagement rate as (likes + replies + reposts) / views. We’ll filter to posts with at least one view and a non-null, positive engagement rate so that posts with no distribution aren’t driving the medians.
After filtering to posts that received at least one engagement and have views, we’re left with around 1.85 million posts: 919K image posts, 770K text posts, and 164K video posts. The smaller video sample is worth keeping in mind throughout the analysis.
Naive Comparison: Median Engagement Rates
The chart below shows the median engagement rate by format type across all of 2025. On the surface, video leads comfortably, followed by images, and then text.
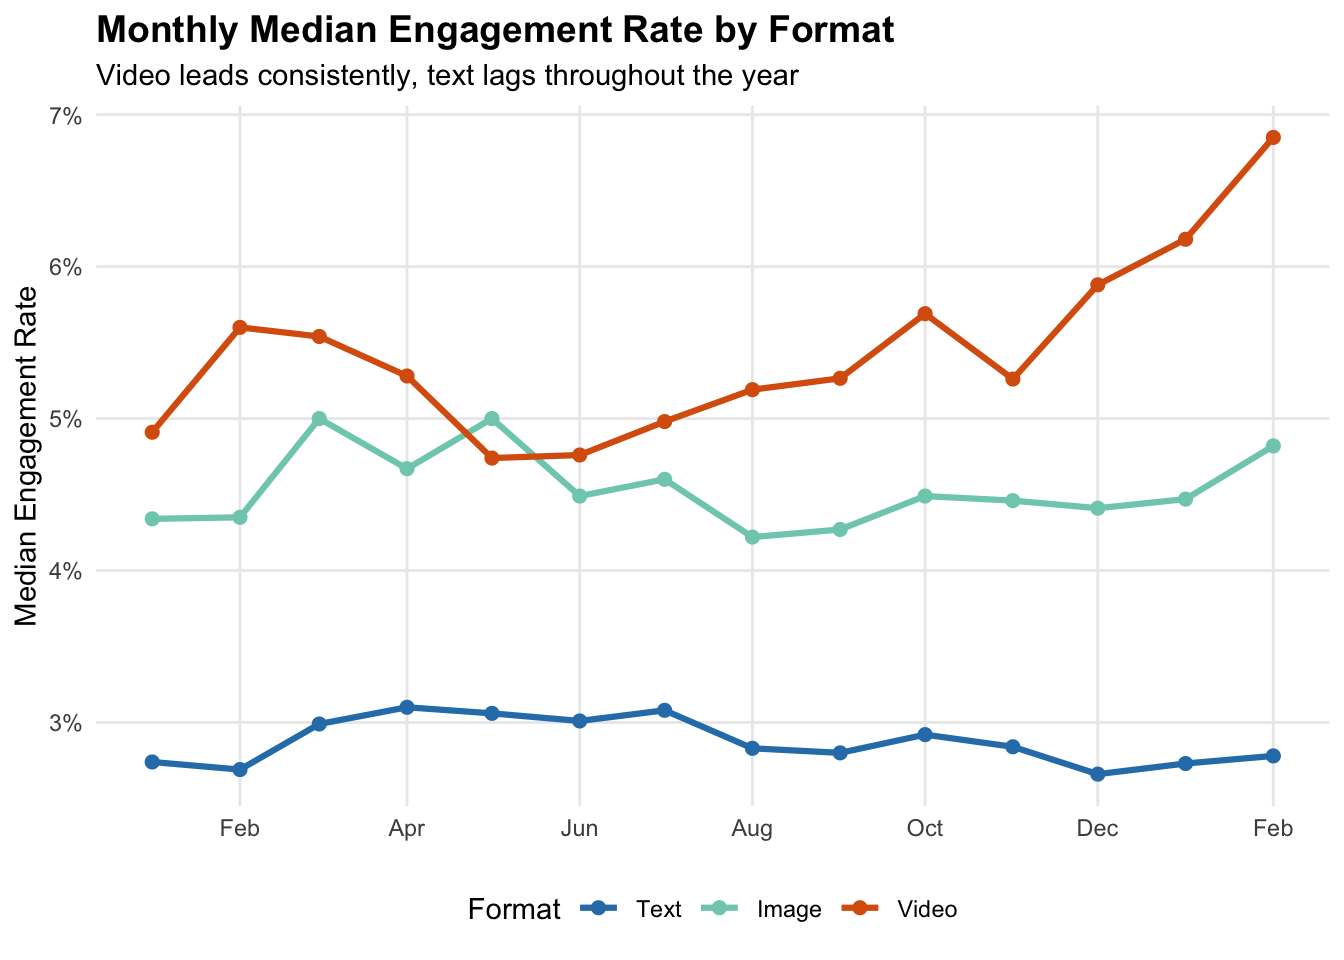
We can also look at how these medians have evolved over the course of the year. Video consistently sits above image and text across all months, while text consistently lags.
Code
# monthly median engagement rate by formatposts %>%group_by(month, media_type) %>%summarise(n =n(),med_eng_rate =median(engagement_rate, na.rm =TRUE),.groups ="drop" ) %>%mutate(media_type =factor(media_type, levels =c("text", "picture", "video"))) %>%ggplot(aes(x = month, y = med_eng_rate, color = media_type)) +geom_line(linewidth =1.1) +geom_point(size =2) +scale_y_continuous(labels =function(x) paste0(x, "%")) +scale_x_date(date_breaks ="2 months", date_labels ="%b") +scale_color_manual(values =c("text"="#2c7fb8", "picture"="#7fcdbb", "video"="#d95f0e"),labels =c("Text", "Image", "Video")) +labs(x =NULL,y ="Median Engagement Rate",color ="Format",title ="Monthly Median Engagement Rate by Format",subtitle ="Video leads consistently, text lags throughout the year" ) +theme_minimal() +theme(plot.title =element_text(face ="bold", size =14),plot.subtitle =element_text(size =11),panel.grid.minor =element_blank(),legend.position ="bottom" )
These naive comparisons are a reasonable starting point, but they have an important limitation. Some accounts naturally get more engagement than others because of their audience size, niche, or posting frequency. And some accounts specialize in one format — heavy video creators may already have larger or more engaged audiences. The naive medians may be telling us something about who posts each format, not necessarily how each format performs.
Z-Score Analysis
A Z-score analysis is a way to see how each post performed relative to that account’s own typical engagement. Instead of comparing accounts to each other, we compare each account to itself.
For each account, we calculate the mean and standard deviation of log-engagements across all of its posts. A Z-score of zero means the post performed exactly at the account’s average. A positive Z-score means the post outperformed the account’s baseline; a negative score means it underperformed.
# A tibble: 3 × 4
  media_type      n mean_z median_z
  <chr>       <int>  <dbl>    <dbl>
1 picture    912693 -0.005   -0.148
2 text       765638 -0.007   -0.149
3 video      162102  0.059   -0.093
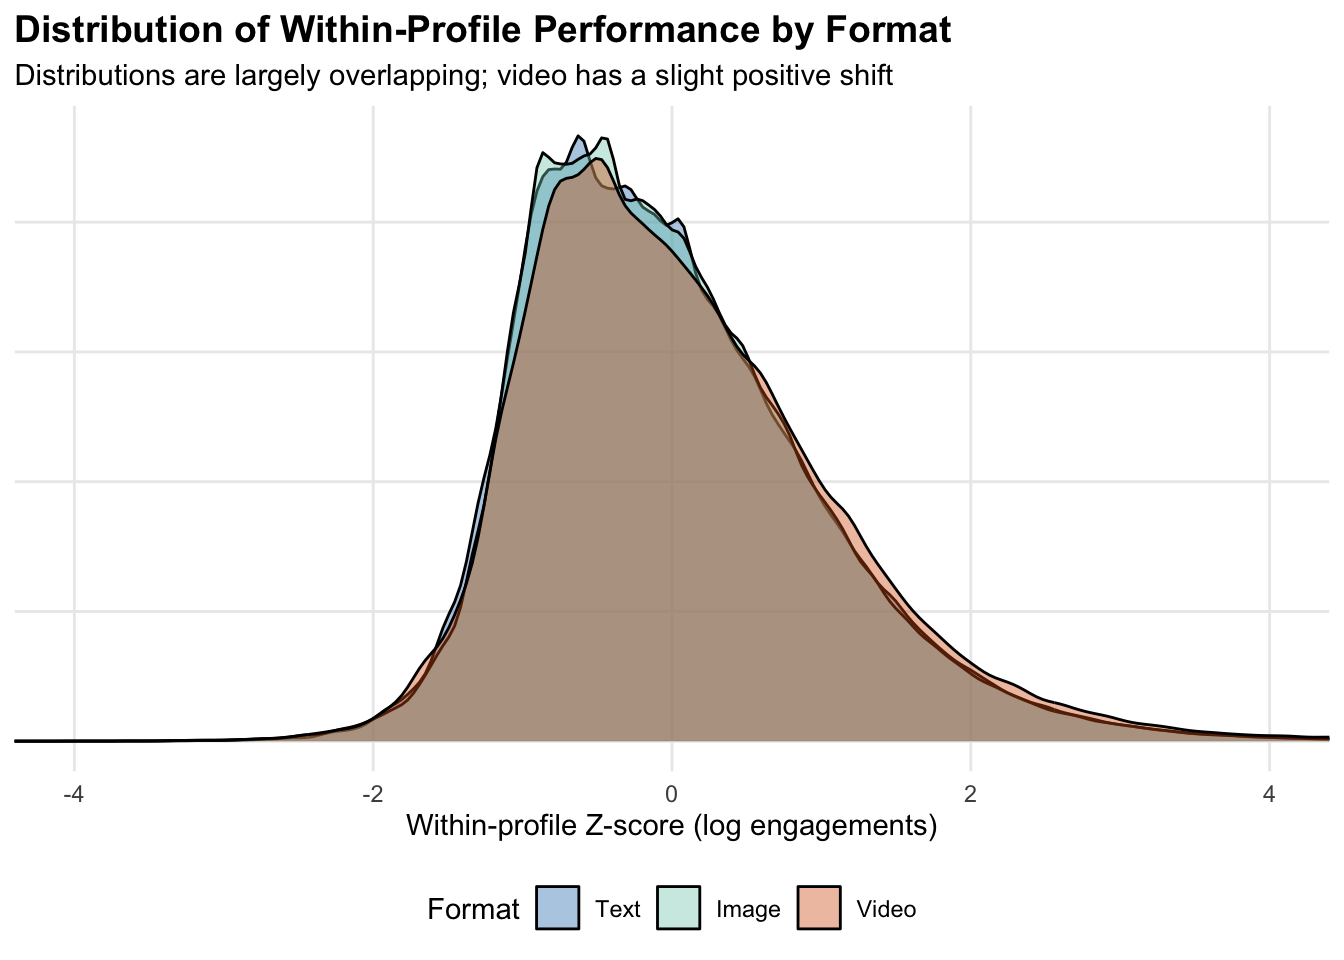
The mean Z-scores are close to zero for all three format types, which suggests that once we account for baseline account performance, the format differences are modest. Video has a slightly positive mean Z-score, while text and image are essentially flat. The distribution charts below make this easier to see.
Code
# Z-score density by formatposts_z %>%mutate(media_type =factor(media_type, levels =c("text", "picture", "video"),labels =c("Text", "Image", "Video"))) %>%ggplot(aes(x = z_log_eng, fill = media_type)) +geom_density(alpha =0.4) +coord_cartesian(xlim =c(-4, 4)) +scale_fill_manual(values =c("Text"="#2c7fb8", "Image"="#7fcdbb", "Video"="#d95f0e")) +labs(x ="Within-profile Z-score (log engagements)",y =NULL,fill ="Format",title ="Distribution of Within-Profile Performance by Format",subtitle ="Distributions are largely overlapping; video has a slight positive shift" ) +theme_minimal() +theme(plot.title =element_text(face ="bold", size =14),plot.subtitle =element_text(size =11),panel.grid.minor =element_blank(),legend.position ="bottom",axis.text.y =element_blank() )
Per-Profile Differences
For accounts that posted all three format types, we can calculate a per-profile difference: the average Z-score for each format, compared to each other. This lets us see how consistently one format outperforms another within the same account.
Code
# per-profile mean Z by format (for profiles using all 3 formats)profile_format <- posts_z %>%group_by(profile_id, media_type) %>%summarise(mean_z =mean(z_log_eng, na.rm =TRUE), .groups ="drop")all_formats_wide <- profile_format %>%group_by(profile_id) %>%filter(n_distinct(media_type) ==3) %>% tidyr::pivot_wider(names_from = media_type, values_from = mean_z) %>%mutate(diff_video_vs_picture = video - picture,diff_text_vs_picture = text - picture,diff_video_vs_text = video - text )cat("Profiles using all three formats:", nrow(all_formats_wide), "\n\n")
Profiles using all three formats: 2396
Code
# summary of within-profile differencestibble::tibble(Comparison =c("Video vs Image", "Video vs Text", "Text vs Image"),`Median Z Difference`=c(round(median(all_formats_wide$diff_video_vs_picture, na.rm =TRUE), 3),round(median(all_formats_wide$diff_video_vs_text, na.rm =TRUE), 3),round(median(all_formats_wide$diff_text_vs_picture, na.rm =TRUE), 3) ),`Share Positive (%)`=c(round(mean(all_formats_wide$diff_video_vs_picture >0, na.rm =TRUE) *100, 1),round(mean(all_formats_wide$diff_video_vs_text >0, na.rm =TRUE) *100, 1),round(mean(all_formats_wide$diff_text_vs_picture >0, na.rm =TRUE) *100, 1) ))
# A tibble: 3 × 3
  Comparison     `Median Z Difference` `Share Positive (%)`
  <chr>                          <dbl>                <dbl>
1 Video vs Image                -0.022                 48.1
2 Video vs Text                 -0.078                 46.7
3 Text vs Image                  0.044                 51.9
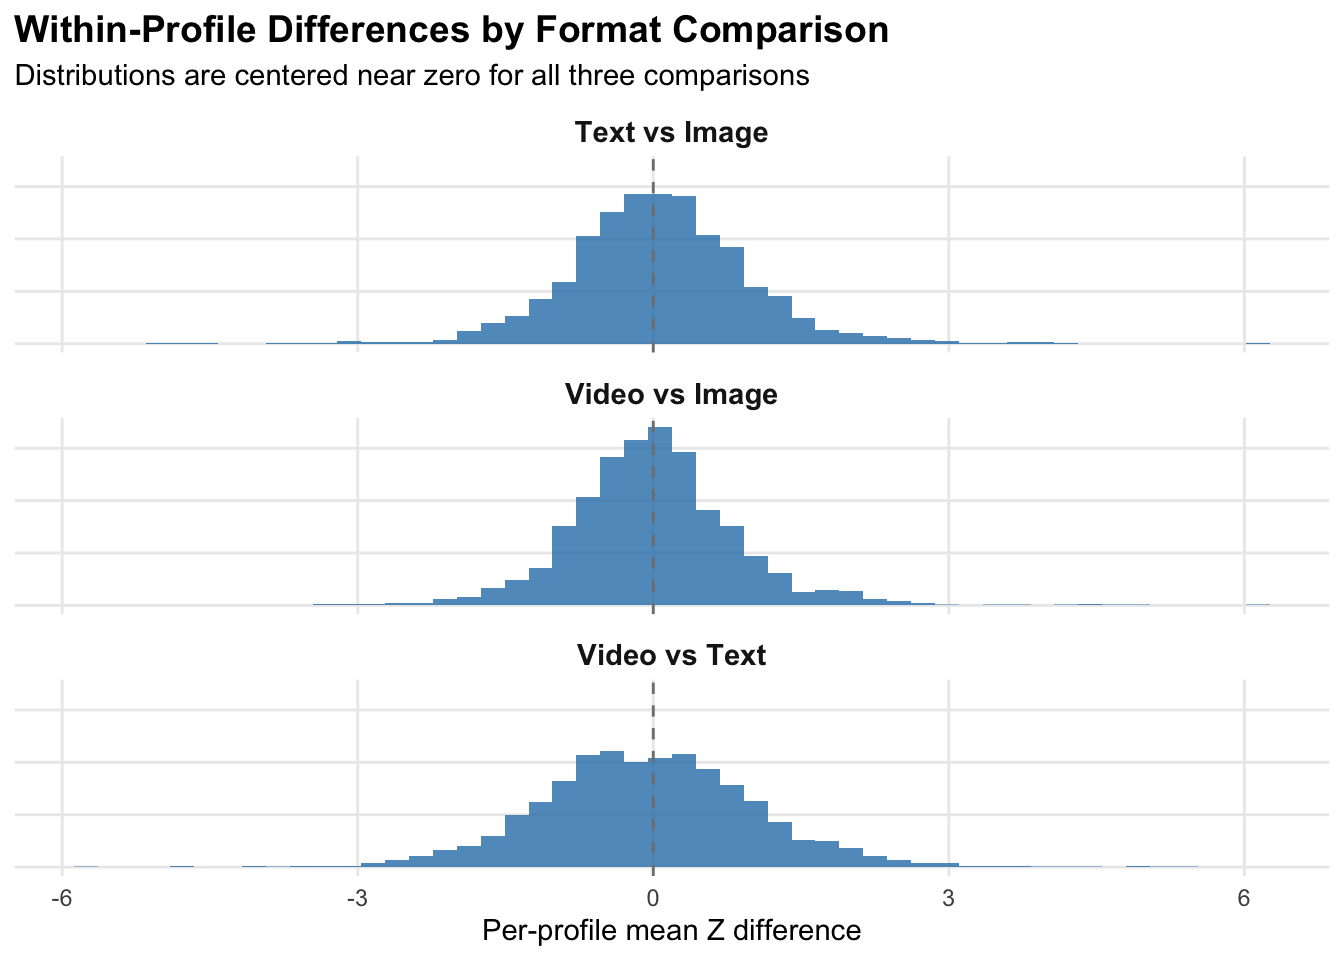
The per-profile comparison shows that video edges out image posts in 48% of accounts, and video versus text is similarly split at 47%. Text versus image is essentially a coin flip, with 52% of profiles getting better Z-scores from text.
The distribution of per-profile differences illustrates this lack of a consistent winner. The distributions are centered close to zero for all three comparisons.
Code
# distributions of per-profile differencesall_formats_wide %>% tidyr::pivot_longer(cols =c(diff_video_vs_picture, diff_text_vs_picture, diff_video_vs_text),names_to ="comparison",values_to ="diff" ) %>%mutate(comparison =recode(comparison,"diff_video_vs_picture"="Video vs Image","diff_text_vs_picture"="Text vs Image","diff_video_vs_text"="Video vs Text" )) %>%ggplot(aes(x = diff)) +geom_histogram(bins =50, fill ="#2c7fb8", alpha =0.8) +geom_vline(xintercept =0, linetype =2, color ="grey50") +facet_wrap(~comparison, ncol =1) +labs(x ="Per-profile mean Z difference",y =NULL,title ="Within-Profile Differences by Format Comparison",subtitle ="Distributions are centered near zero for all three comparisons" ) +theme_minimal() +theme(plot.title =element_text(face ="bold", size =14),plot.subtitle =element_text(size =11),panel.grid.minor =element_blank(),strip.text =element_text(face ="bold", size =11),axis.text.y =element_blank() )
Fixed Effects Regression
Next we’ll use fixed effects regression to more formally estimate the within-profile relationship between format and engagement. A profile fixed-effects model compares each account to its own baseline, so all time-invariant account-level characteristics — audience size, niche, content quality — are held constant.
The outcome is log-engagements. Coefficients on the log scale are approximately interpretable as percent differences.
Code
# fixed effects model: log engagements on format, with profile FEfe_model <-feols( log_engagements ~ media_type | profile_id,data = posts,cluster ="profile_id")summary(fe_model)
Text posts see about 4.3% fewer engagements than image posts within the same account, though this difference is not statistically significant (p ≈ 0.14).
Video posts see about 20% more engagements than image posts within the same account, and this result is statistically significant (p < 0.001).
The within R-squared is only 0.16%, which tells us that format type explains almost none of the variation in engagement once we control for account identity. Most of what drives engagement on Threads is account-specific — who is posting, how big their audience is, and the quality of the individual piece of content.
Caveats
The most important limitation here is that even the fixed-effects model isn’t a controlled experiment. We can’t say that switching from image to video posts causes a 20% lift in engagement. Accounts might post video on their best content and text on their more routine updates. The format itself, or the content chosen for each format, could be driving the difference.
It’s also worth noting that only 2,396 accounts in our sample posted all three format types. Many accounts specialize in one or two formats, so the within-profile analysis captures a somewhat unusual segment — accounts active and experimental enough to try multiple formats. These may not be representative of the typical Threads creator.
Finally, Threads as a platform is still evolving. Its algorithm, user base, and creator population changed substantially in 2025, and any conclusions here are snapshots of a moving target.