Threads Trending Topics: Do They Actually Move the Needle?
insights
threads
Author
Julian Winternheimer
Published
March 2, 2026
Overview
Threads recently introduced a trending topics feature that lets creators attach their posts to popular, platform-wide conversations. In theory, tapping into a trending topic should surface your content to a broader or more interested audience. This analysis looks at every Threads post sent through Buffer since the beginning of February 2026 and tests whether posts that use a trending topic actually perform better, after controlling for account-level differences.
What We Found
Once we control for account-level differences using a fixed-effects model, posts that use a trending topic have engagement rates about 0.48 percentage points higher than posts from the same account that don’t. To put that in concrete terms: if an account’s posts typically earn a 4.7% engagement rate, trending topic posts from that same account average around 5.2%. That’s a 0.48 percentage point absolute increase, or roughly a 10% relative lift.
The result is statistically significant (p < 0.001) and holds consistently across all four weeks of data.
Data
The query below pulls all Threads posts sent through Buffer since February 1, 2026. The threads_topic field is non-null and non-empty when a post was attached to a trending topic.
Code
sql <-" SELECT id AS post_id, profile_id, organization_id, created_at, sent_at, threads_topic, engagement_rate, likes, comments, reposts, media_type FROM dbt_buffer.publish_updates WHERE profile_service = 'threads' AND created_at >= '2026-02-01' AND status = 'sent' AND is_deleted = FALSE"posts <-bq_query(sql = sql)saveRDS(posts, "threads_topics.rds")
Before running the model, it’s useful to see the unadjusted averages. Keep in mind that this mixes together account-level differences, so we shouldn’t read too much into it.
The raw average is higher for posts with a trending topic (6.1% vs 4.7%), but this likely reflects the fact that accounts using trending topics tend to have smaller, more niche audiences that engage at higher rates regardless of topic usage. The fixed-effects model below accounts for that.
Fixed-Effects Model
To isolate the effect of trending topics from baseline differences between accounts, we use a fixed-effects regression with profile_id as the grouping variable. This compares each account to itself, controlling for anything constant at the account level (follower count, niche, posting style, etc.). The sample is restricted to the 2,704 accounts that posted both with and without a trending topic, since those are the only accounts that provide within-account variation.
Code
both_types <- posts |>group_by(profile_id) |>filter(any(has_topic) &any(!has_topic)) |>ungroup()cat("Profiles with both types:", n_distinct(both_types$profile_id), "\n")cat("Posts in FE sample:", nrow(both_types), "\n")m_rate <-feols(engagement_rate ~ has_topic | profile_id,data = both_types,vcov ="cluster")etable(m_rate, digits =3)
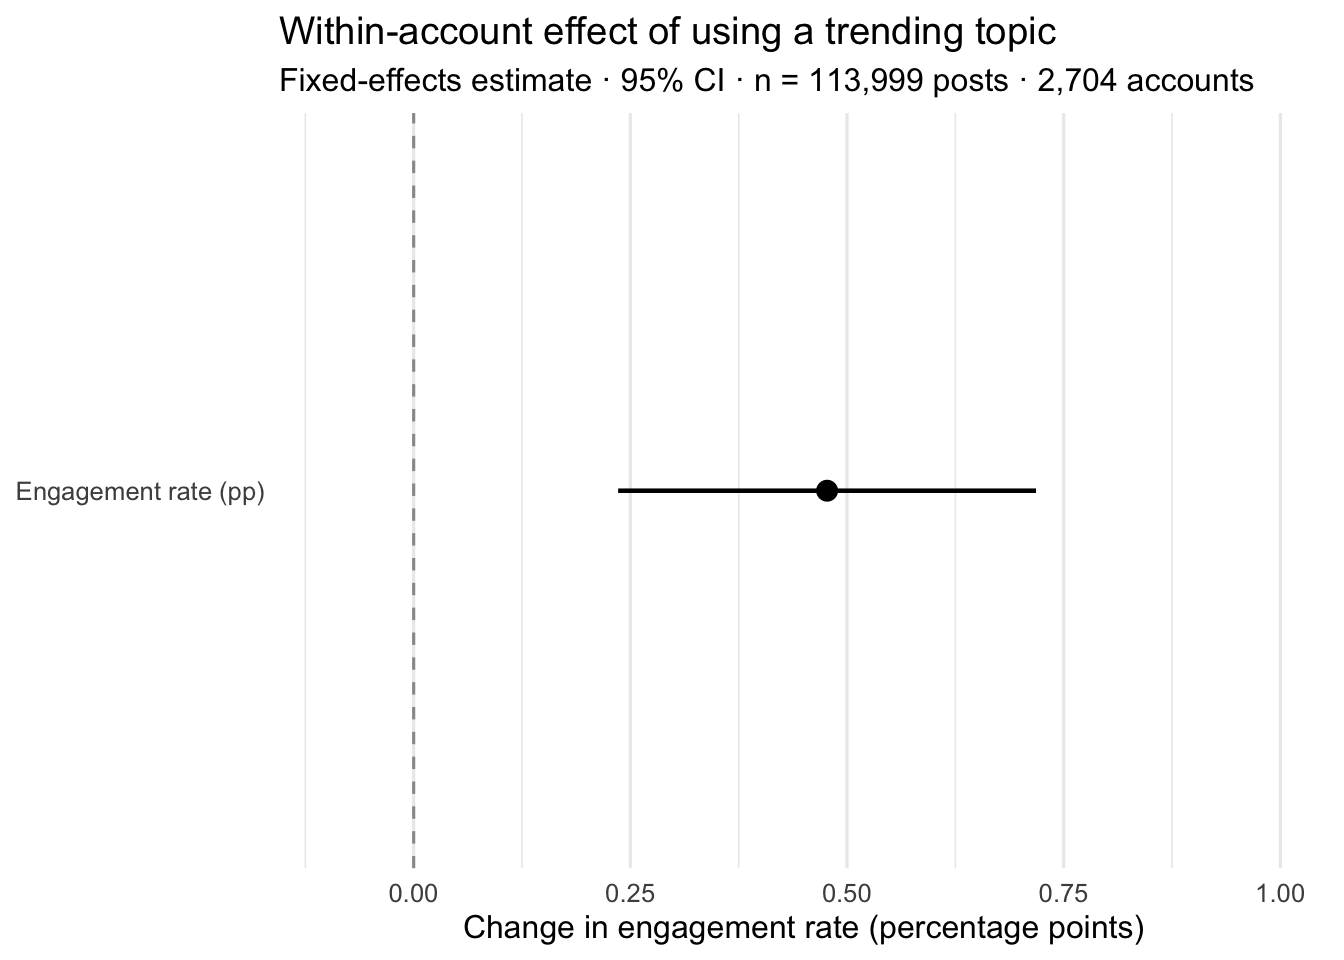
The within-account estimate is +0.477 percentage points. In plain language: an account that posts both with and without trending topics typically sees its engagement rate go from about 4.7% to about 5.2% on trending topic posts. That’s a small absolute difference but a meaningful relative one (~10%), and it’s consistent enough across accounts to be statistically significant.
Code
tibble(label ="Engagement rate (pp)",est =0.477,lo =0.477-1.96*0.123,hi =0.477+1.96*0.123) |>ggplot(aes(x = est, xmin = lo, xmax = hi, y = label)) +geom_vline(xintercept =0, linetype ="dashed", color ="grey60") +geom_pointrange(linewidth =0.8, size =0.6) +scale_x_continuous(limits =c(-0.1, 1.0)) +labs(x ="Change in engagement rate (percentage points)",y =NULL,title ="Within-account effect of using a trending topic",subtitle ="Fixed-effects estimate · 95% CI · n = 113,999 posts · 2,704 accounts" ) +theme_minimal(base_size =12) +theme(panel.grid.major.y =element_blank())
The dot shows the within-account fixed-effects estimate. The bars are 95% confidence intervals. The estimate is positive and does not cross zero.
Account-Level Comparison
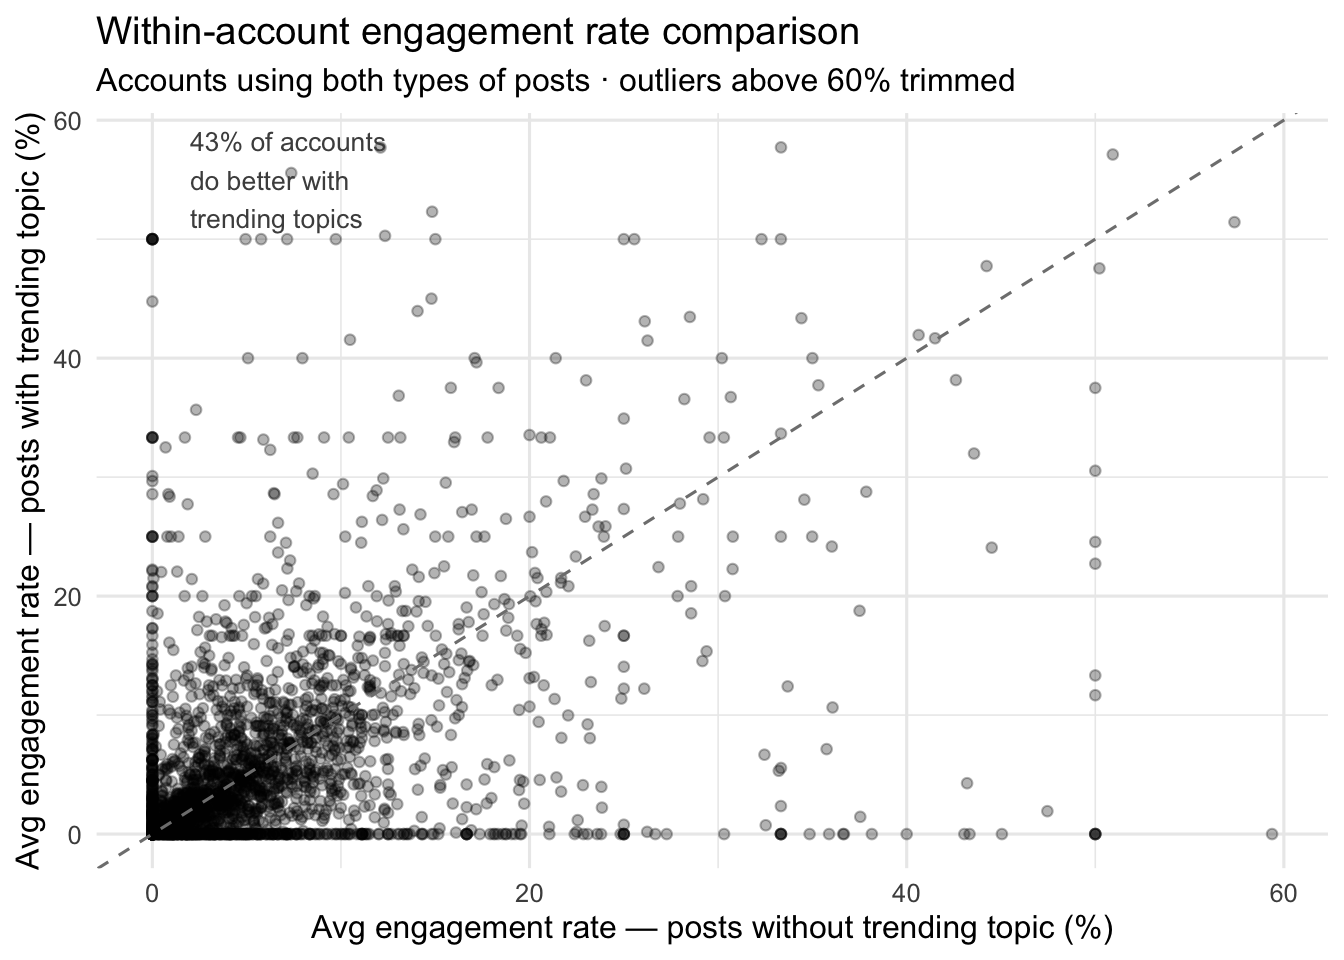
For the 2,704 accounts that posted both with and without trending topics, we can plot each account’s average engagement rate in both conditions. Points above the diagonal line performed better on trending topic posts.
Code
acct_rates <- posts |>group_by(profile_id) |>filter(any(has_topic) &any(!has_topic)) |>summarise(rate_with =mean(engagement_rate[has_topic], na.rm =TRUE),rate_without =mean(engagement_rate[!has_topic], na.rm =TRUE),.groups ="drop" ) |>filter(!is.na(rate_with) &!is.na(rate_without) & rate_with <60& rate_without <60)pct_above <-mean(acct_rates$rate_with > acct_rates$rate_without)ggplot(acct_rates, aes(x = rate_without, y = rate_with)) +geom_point(alpha =0.3, size =1.5) +geom_abline(slope =1, intercept =0, linetype ="dashed", color ="grey50") +annotate("text", x =2, y =55,label =paste0(scales::percent(pct_above, accuracy =1)," of accounts\ndo better with\ntrending topics"),size =3.5, color ="grey30", hjust =0) +labs(x ="Avg engagement rate — posts without trending topic (%)",y ="Avg engagement rate — posts with trending topic (%)",title ="Within-account engagement rate comparison",subtitle ="Accounts using both types of posts · outliers above 60% trimmed" ) +theme_minimal(base_size =12)
Each dot is one account. Points above the dashed line have a higher average engagement rate on trending-topic posts.
Weekly Trend
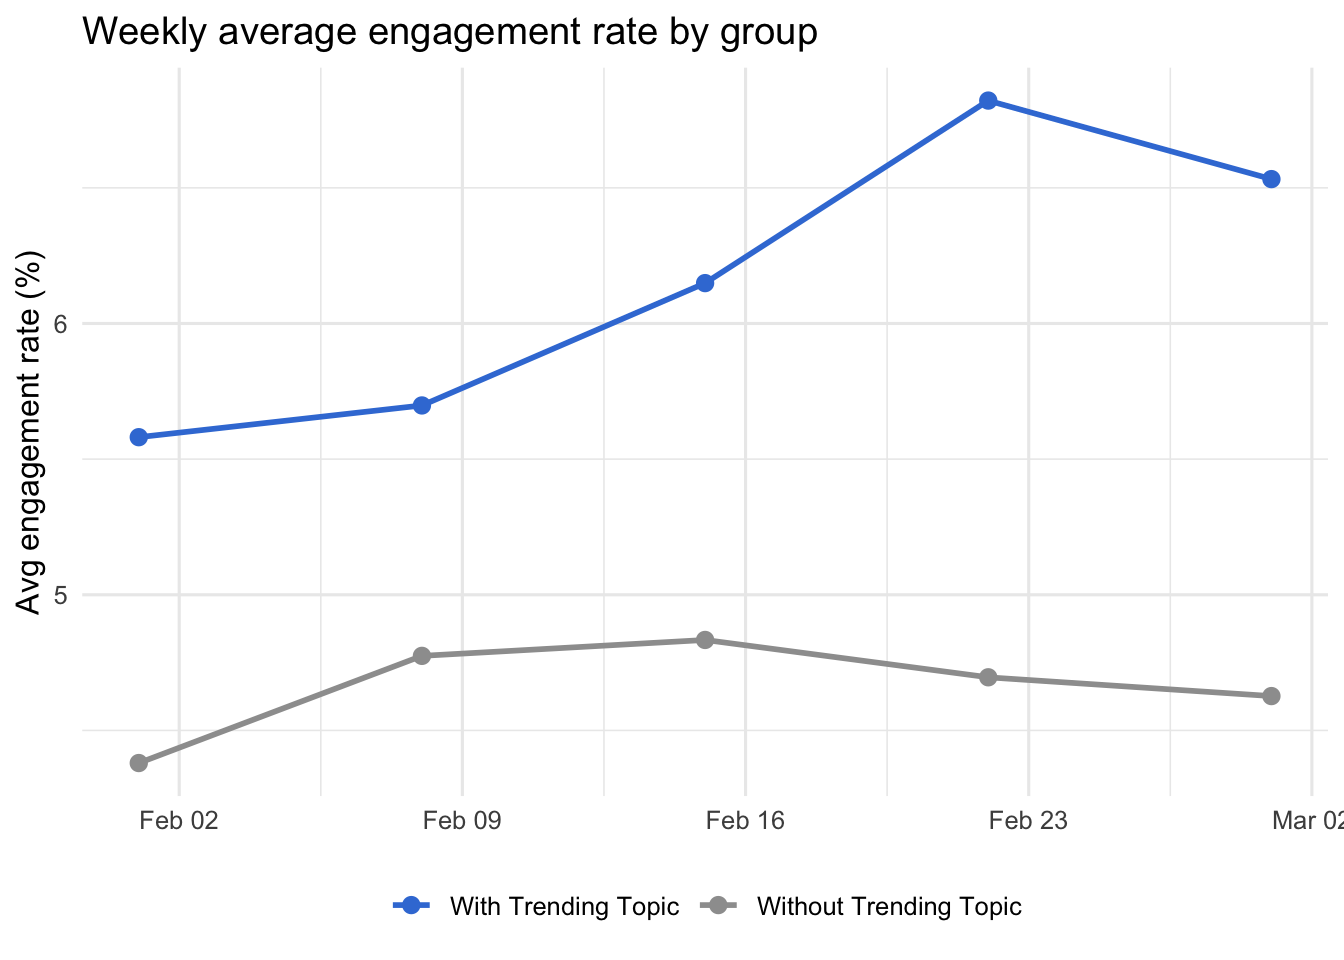
The engagement rate gap holds across all four full weeks of data, which rules out a one-week spike driving the result.
Average engagement rate by week. The last data point (Mar 1) covers only a partial week.
Distribution at the Tails
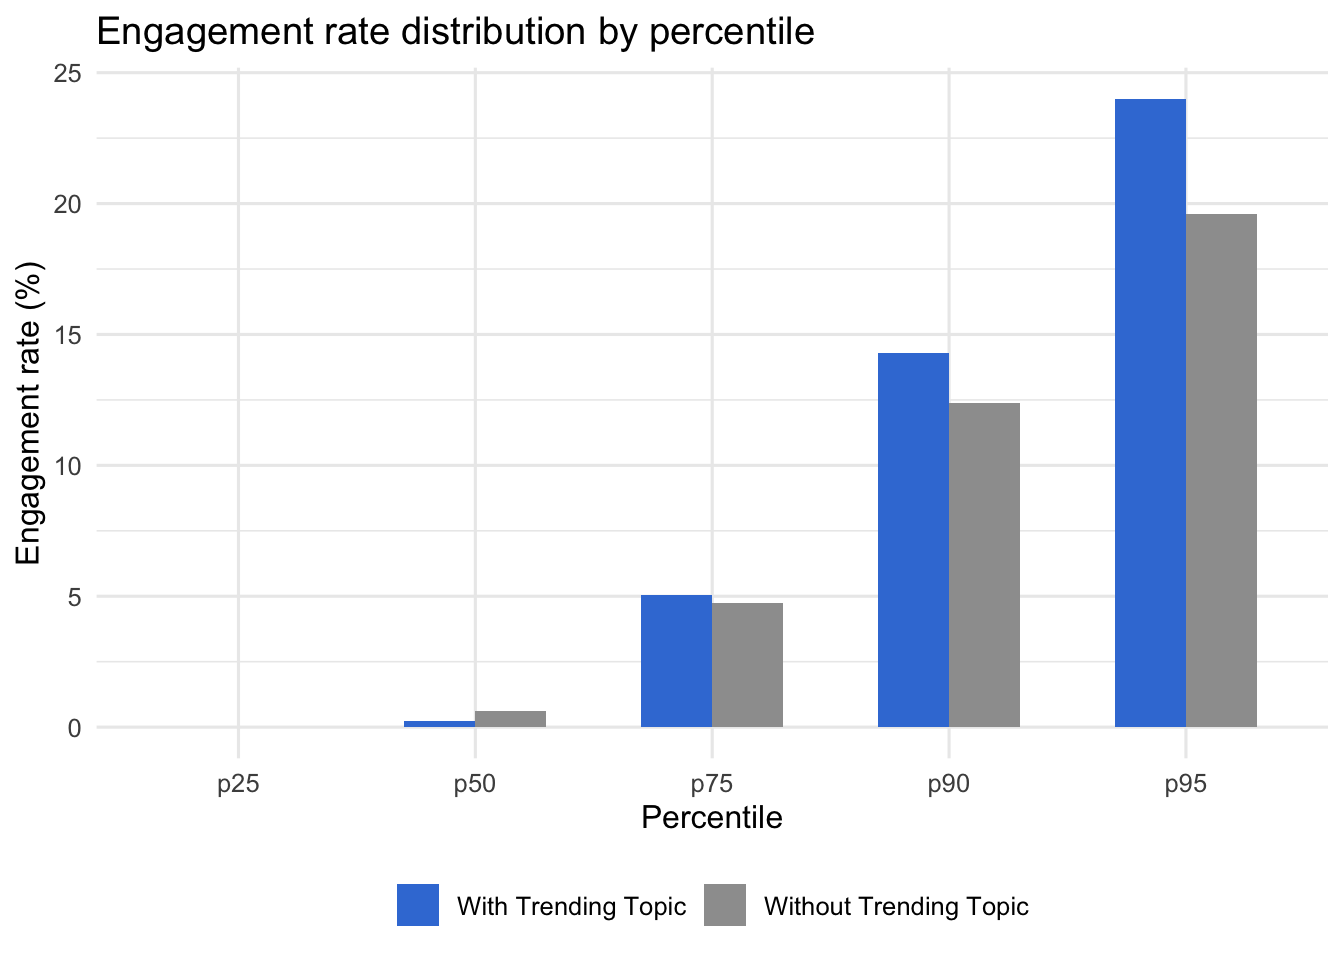
The advantage of trending topics shows up mainly at the upper end of the distribution. At the median, posts with a trending topic actually sit slightly lower (0.23% vs 0.61%), but by p75 they pull ahead, and at p90 and p95 the advantage is clear.
Engagement rate at each percentile for both groups. The gap widens at p75 and above.
Interpretation
Within the same account, posts that use a trending topic tend to earn about 0.5 percentage points more engagement rate than posts that don’t. If an account’s baseline is 4.7%, that works out to around 5.2% on trending topic posts — a 10% relative lift. The effect is consistent week over week and shows up most clearly at the upper end of the distribution.
For creators, this probably means trending topics won’t dramatically change your numbers, but they do seem to connect posts with a more engaged slice of readers. If engagement rate matters to you (and it matters to the algorithm), they look worthwhile when the topic is genuinely relevant to what you’re posting.
One caveat: this analysis can’t rule out selection. Creators might reach for trending topics on posts they already feel good about, which would inflate the engagement rate estimate. A randomized experiment would be needed to fully close that door.
Methodology Notes
Period: February 1 – March 2, 2026
Sample: 990,695 sent Threads posts with engagement rate data from 29,221 profiles; FE sample restricted to 113,999 posts from 2,704 profiles with variation in trending topic usage
Fixed effects: Profile-level (absorbs all time-constant account characteristics)
Standard errors: Clustered at the profile level
Outcome: engagement_rate as stored in dbt_buffer.publish_updates
Trending topic indicator: threads_topic IS NOT NULL AND threads_topic != ''